RUBY
[CRIME] 15. 서울시 범죄 현황 발생 장소 분석 본문
서울시 범죄 현황 데이터 분석 프로젝트
15. 서울시 범죄 현황 발생 장소 분석
1. 발생 장소별 데이터

crime_loc_raw = pd.read_csv(
    "../data/02. crime_in_Seoul_location.csv", thousands=",", encoding="euc-kr"
)
crime_loc_raw.head()
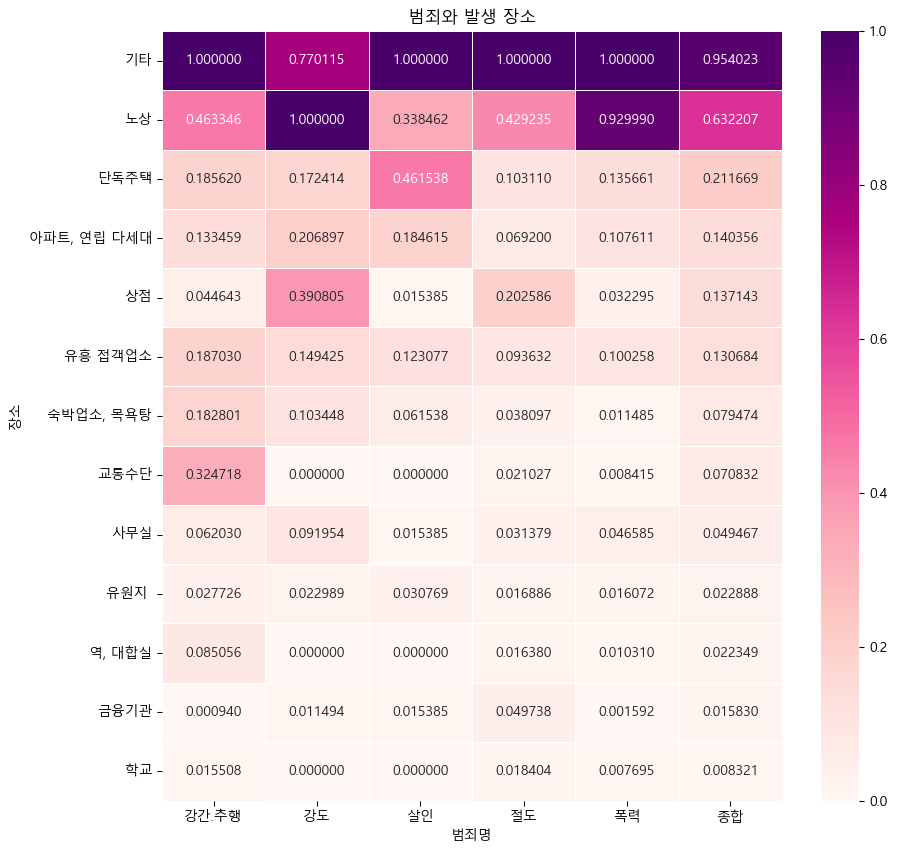
강남의 범죄 발생이 많은 것은 혹시 유흥업소의 밀집과 관련이 있지 않을까?
확인을 위해 최초 받았던 발생 장소별 데이터를 읽어보자.

crime_loc_raw["범죄명"].unique()

crime_loc_raw["장소"].unique()

crime_loc = crime_loc_raw.pivot_table(
    crime_loc_raw, index=["장소"], columns=["범죄명"], aggfunc=[np.sum]
)
crime_loc.columns = crime_loc.columns.droplevel([0, 1])
crime_loc.head()

col = ["살인", "강도", "강간", "절도", "폭력"]
crime_loc_norm = crime_loc / crime_loc.max()
crime_loc_norm.head()

crime_loc_norm["종합"] = np.mean(crime_loc_norm, axis=1)
crime_loc_norm.head()


crime_loc_norm_sort = crime_loc_norm.sort_values(by="종합", ascending=False)


def drawGraph():
    plt.figure(figsize=(10, 10))
    sns.heatmap(crime_loc_norm_sort, annot=True, fmt="f", linewidths=0.5, cmap="RdPu")
    plt.title("범죄와 발생 장소")
    plt.show()

drawGraph()'데이터 분석 > EDA_웹크롤링_파이썬프로그래밍' 카테고리의 다른 글
| [WebData] 2. 크롬 개발자 도구 - 환율정보 가져오기 (0) | 2023.02.05 |
|---|---|
| [WebData] 1. BeautifulSoup for web data (0) | 2023.02.05 |
| [CRIME] 14. 서울시 범죄 현황에 대한 지도 시각화 (0) | 2023.02.04 |
| [CRIME] 13. 지도 시각화(Folium) (0) | 2023.02.04 |
| [CRIME] 12. 서울시 범죄현황 데이터 시각화(pair plot, heat map) (0) | 2023.02.03 |
Comments


